EMBED ROIs
Documentation on Regions of Interest (ROIs) in the Emory Breast Imaging Dataset (EMBED)
EMBED contains a number of ROIs that were generated when the annotating radiologist made an indication during their exam. This page discusses what they represent, how they were derived, and how to use them.
What do they represent?
EMBED ROIs were collected at the time of screening so they represent a snapshot of the radiologist's decision making in that moment. Due to this, they're most common in (but not exclusive to) screening exams with BI-RADS A findings.
How were they derived?
All ROIs in EMBED were mapped from elliptical coordinates to rectangles and were derived from one of two possible source objects:
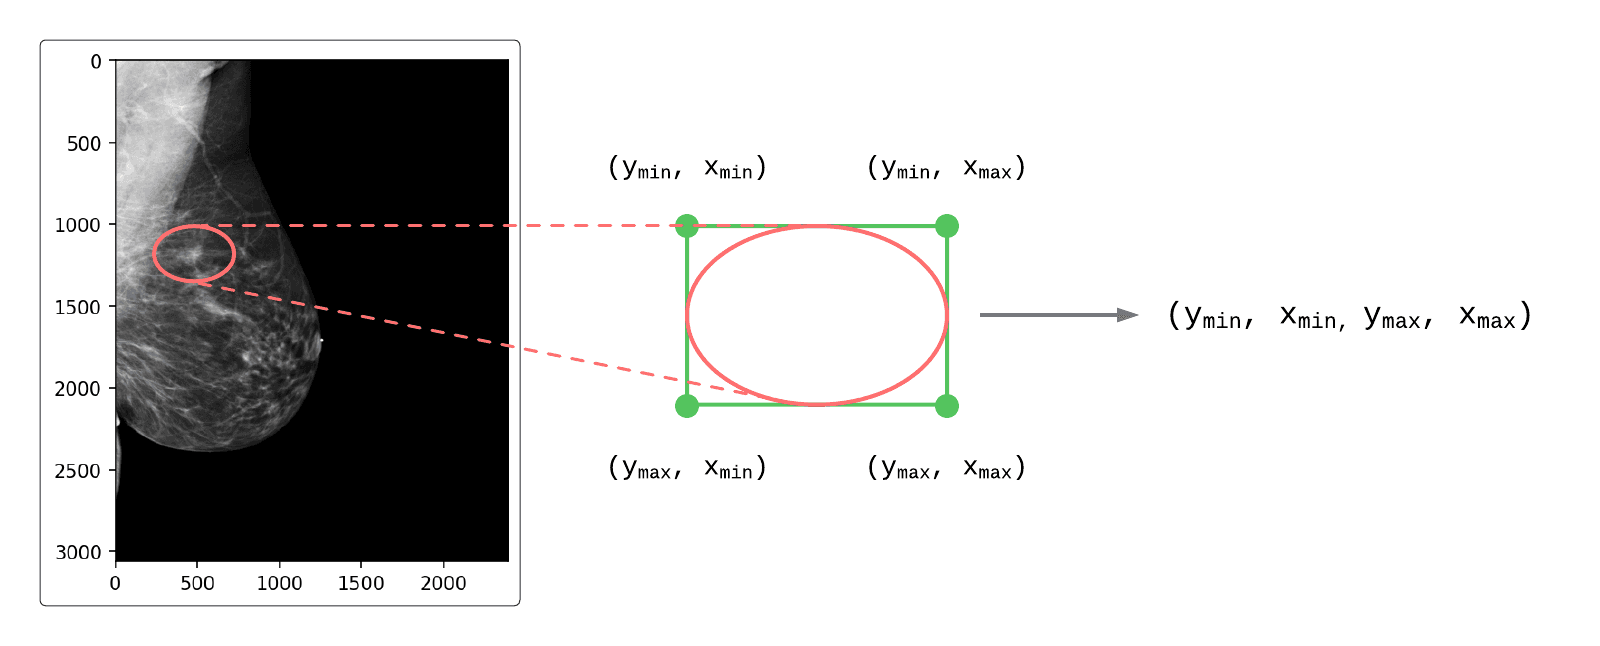 Figure 1: Mapping elliptical ROI coordinates to rectangular coordinates
- Secondary Screen Capture (SSC) Images Some ROIs were derived from SSC images. These were generated when an ROI was created and saved as a separate image (including the ROI baked into the pixel data) in the PACS. These images had exam-level identifiers present, but did not have a direct match to their source DICOMs in their metadata. To handle this, structure similarity index measure (SSIM) was used to match SSCs to their source DICOMs (example shown in Figure 2).
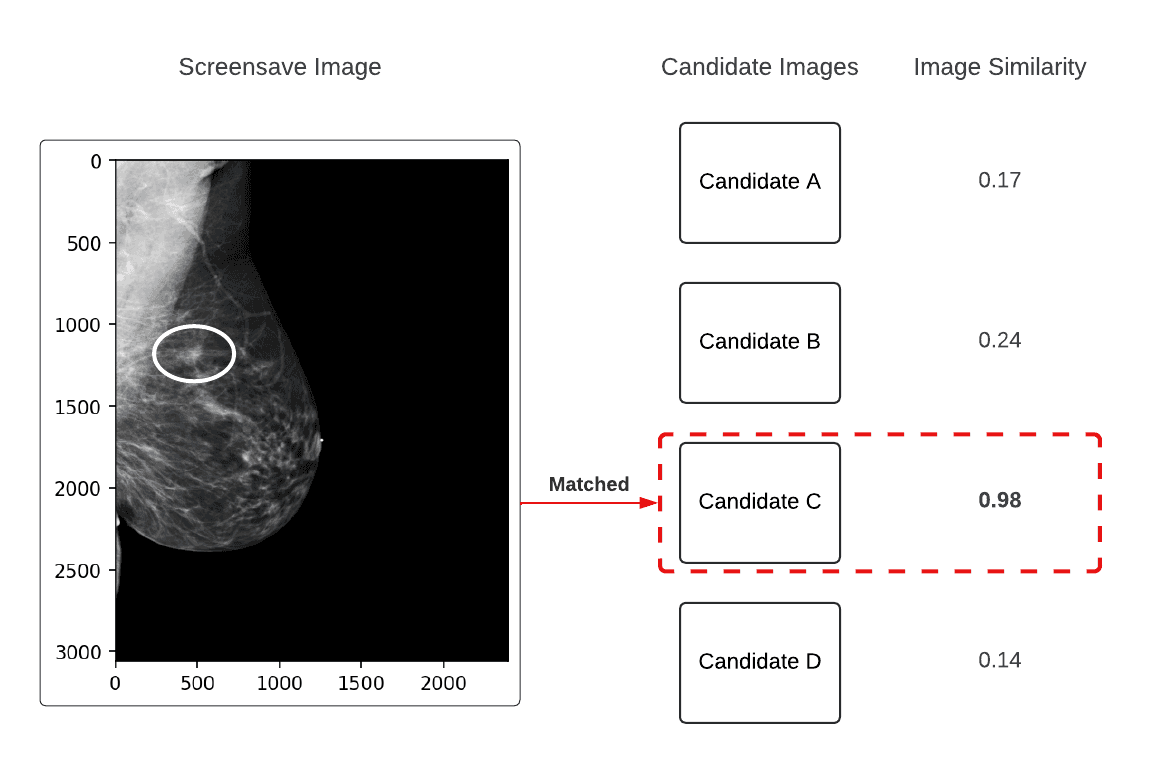 Figure 2: Example of the SSC-to-DICOM matching process
- DICOM Annotation Objects Some ROIs were derived from DICOM annotation objects which contained no pixel data and instead had a linked SOPInstanceUID and a set of elliptical coordinates. These coordinates were mapped from ellipses to rectangles (as shown in Figure 1) and matched back to their source DICOMs by SOPInstanceUID.
Usage
Current ROI schema
ROIs are stored in three coordinated columns:
| Column | Type in table | Meaning |
|---|---|---|
num_ROI | integer | Number of ROIs for that image row. |
ROI_coords | string | Serialized list of ROI boxes in [ymin, xmin, ymax, xmax] format. |
ROI_frames | string | Serialized list of DBT frame-index lists. Only populated for DBT (FinalImageType == "3D") rows with ROIs. |
DBT ROI frame annotations are available for a subset of DBT images. When working with depth-localized ROIs, filter to rows where FinalImageType == "3D" and num_ROI > 0.
In Python, parse these string columns with ast.literal_eval() (documentation).
import ast
import pandas as pd
roi_coords: list[list[int]] = ast.literal_eval(row.ROI_coords)
roi_frames: list[list[int]] = ast.literal_eval(row.ROI_frames)

assert len(roi_coords) == row.num_ROI

if row.FinalImageType == "3D" and row.num_ROI > 0:
    # DBT rows: one frame-list per ROI
    assert len(roi_frames) == row.num_ROI
else:
    # 2D / cview rows: frame indices are not used
    assert roi_frames == []
For DBT rows, ROI coordinates and frame indices are aligned by position:
ROI_coords[i]gives the XY bounding box.ROI_frames[i]gives the frame index (or indices) where that ROI is present.- Frame indices are zero-based (
0is the first frame) and should satisfy0 <= frame_idx < ImagesInAcquisition. - A frame list can contain one or many indices; treat them as the explicit set of relevant slices (not necessarily a contiguous range).
Examples:
- 2D/cview row:
ROI_coords = [[1401, 980, 1510, 1148]]ROI_frames = []
- DBT row (single-frame ROI):
ROI_coords = [[1000, 1342, 1156, 1520]]ROI_frames = [[14]]
- DBT row (multi-frame ROI):
ROI_coords = [[930, 1158, 1121, 1378]]ROI_frames = [[36, 37, 38, 39, 40]]
 Figure 3: Example of ROI coordinate nesting
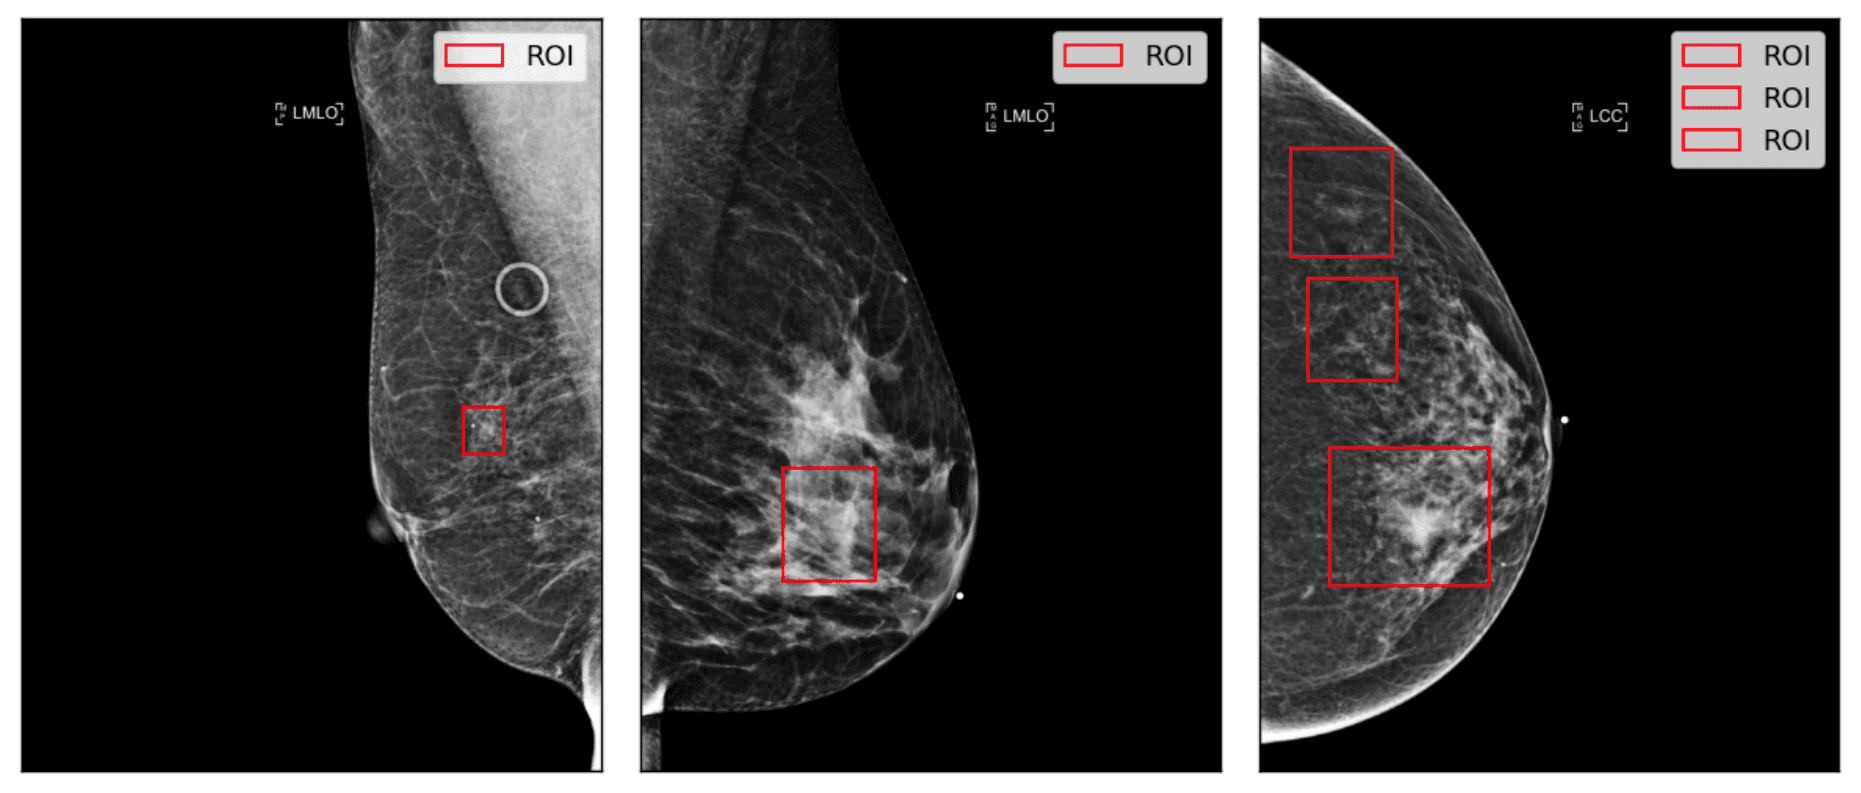 Figure 4: Example of ROI visualizations on source images
Visualizing ROIs
from matplotlib.patches import Rectangle

def plot_rois(row: pd.Series) -> None:
        # extract pixel array from the DICOM
    image: np.ndarray = pydicom.dcmread(row.anon_dicom_path).pixel_array

    # extract ROI coordinates as a list of integers
    roi_list: list[list[int]] = ast.literal_eval(row.ROI_coords)

    # create a figure and plot the image
    fig, ax = plt.subplots(1, 1, dpi=130)
    ax.imshow(image, cmap='gray')

    # disable axis ticks on plot
    ax.set_xticks([])
    ax.set_yticks([])

    for roi in roi_list:
        # unpack ROI values
        ymin, xmin, ymax, xmax = roi

        # format the roi into a patch
        roi_patch = Rectangle(
            (xmax, ymax),
            xmin - xmax,
            ymin - ymax,
            edgecolor='xkcd:bright red',
            fc='None',
            label='ROI'
        )
        # add the patch to the axes
        ax.add_patch(roi_patch)

    ax.legend()
    fig.show()

plot_rois(row)
Extract ROIs as Patches
One way to work with ROIs is to extract the pixels within each ROI and save them as image patches.
Code Snippet: Extract patches from DBT ROIs
import ast
import matplotlib.pyplot as plt
import pydicom.pixels

roi_coords: list[list[int]] = ast.literal_eval(row.ROI_coords)
roi_frames: list[list[int]] = ast.literal_eval(row.ROI_frames)

if row.FinalImageType == "3D":
    volume = pydicom.pixels.pixel_array(row.anon_dicom_path)  # [frames, rows, cols]

    for (y_min, x_min, y_max, x_max), frames in zip(roi_coords, roi_frames):
        for frame_idx in sorted(set(frames)):
            patch = volume[frame_idx, y_min:y_max, x_min:x_max]
            plt.imshow(patch, cmap="gray")
            plt.title(f"ROI patch, frame {frame_idx}")
            plt.show()
Since ROIs can have varying dimensions, they are commonly tissue- or black-padded to normalize their dimensions. Figure 5 shows some examples of these different approaches and the snippets below contain example code for how this could be done.

 Figure 5: Examples of patch tissue-padding versus black-padding (512x512 patch size)
Patch Padding Methods
Code Snippet: Example function to tissue-pad a patch
def tissue_pad_patch(img: np.ndarray, roi: list[int], patch_size: int) -> np.ndarray:
    """
    function to tissue pad a patch given an image, a single ROI in the
    form [y_min, x_min, y_max, x_max] and the desired patch size
    """

    # unpack roi
    y_min, x_min, y_max, x_max = roi

    # get the center y, x
    y_center: int = (y_min + y_max) // 2
    x_center: int = (x_min + x_max) // 2

    # get initial patch coords
    half_size: int = patch_size // 2
    patch_y_min: int = y_center - half_size
    patch_x_min: int = x_center - half_size
    patch_y_max: int = y_center + half_size
    patch_x_max: int = x_center + half_size

    # correct the patch coords to make sure they fall within the image
    patch_y_max: int = max(min(patch_y_max, img.shape[0]), patch_size)
    patch_x_max: int = max(min(patch_x_max, img.shape[1]), patch_size)

    # ensure y_min is less than y_max - min_roi_size
    # and greater than 0
    patch_y_min: int = max(min(patch_y_min, patch_y_max - patch_size), 0)
    patch_x_min: int = max(min(patch_x_min, patch_x_max - patch_size), 0)

    return img[patch_y_min:patch_y_max, patch_x_min:patch_x_max]